Detect JavaScript Memory Leaks with queryObjects
#javascriptAn API shipped with Chrome Dev console turns out to be a surprisingly easy way to observe how garbage collection works in JavaScript
Memory leaks has been a relatively underdiscussed topic in the JavaScript community, largely because client-side JavaScript, shipped with web pages to browsers, are typically short-lived, compared with their server-side counterpart. Most of the times, a web page doesn't stay open for long and once the user refresh the page or close the tab, memory retained by JavaScript all get automatically released and recycled.
However, as the legendary Douglas Crockford predicted in his nearly 20-year-ago blog post JScript Memory Leaks, the problem with memory leaks has become more prominent with the recent rise of SPA, where web pages are becoming web apps with much deeper user session.
Identifying and debugging JavaScript memory leaks has been mostly an effort involving taking heap snapshots, manually comparing them, cutting through the noise, and diffing out the culprit that caused the leaks. It is a time-consuming task that can’t be easily automated.
In this post I'll show you how we can leverage a lesser-known API called queryObjects to detect memory leaks in Chrome from the DevTools Console.
Note that this post doesn't try to outline a comprehensive list of possible memory leaks in JavaScript applications and how to fix them. For those who are interested in that, I recommend this and this post written by the amazing Nolan Lawson.
Enter queryObjects#
queryObjects takes a constructor and returns an array of objects that were created with the input constructor.
const array = new Uint8Array(1_000_000_000); // allocating 1GB memory
queryObjects(Uint8Array); // logs out an array of all existing uint8 arrays
At the surface it looks like an API to query how many instances of a given class has been created so far. However, it has an undocumented feature of forcing a garbage collection whenever it's called.
My performance profiling results also confirm this.
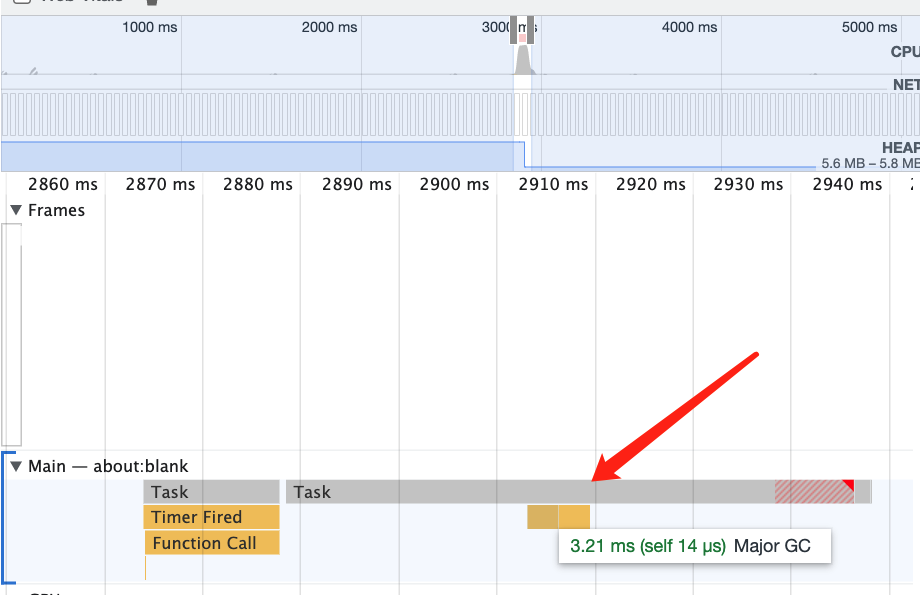
Its ability to query live objects in memory after triggering a garbage collection is a perfect lens into memory allocation and can be served as an educational tool to observe and understand how memory leaks happens without having to look through and diff heap snapshots.
Beyond that, you can even write automated tests with it. Christoph Guttandin wrote a blog post on how to programmatically detect memory leaks by leveraging queryObjects.
queryObjects is only available in Chrome
queryObjects is a Chrome DevTools API. I don't know if there are an exact equivalent in other
browsers. But given how ubiquitous Chromium and V8 are in the current JavaScript landscape, the
garbage collection behavior could very likely be consistent across different platforms and
browsers. I am not 100% sure though.
Minimal reproducible memory leaks examples#
Let's go through some examples where we apply queryObjects to detect memory leaks. The following examples are some of the most common memory leaks patterns, but by no means an exhaustive list.
global object#
Probably the most easy way to introduce memory leaks is by adding properties to global objects, like window.
This can happen accidentally under non-strict mode:
function fn() {
  foo = new Uint8Array(1_000_000_000);
}

fn();
queryObjects(Uint8Array); // logs out an array of uint8Arrays
closure#
JavaScript is a celebration of closures, where a function can freely access free variables (i.e. variables declared outside the function).
Closure is what makes JavaScript an interesting language, but that doesn't come for free: the engine has to keep free variables in memory even after the function where those variables defined finishes execution. It causes memory retention, but we don't normally equate that to memory leaks, unless the browser itself is buggy.
In the following example, the returned function bar closes over object test, thus retaining the memory allocated for it.
class Test {}

function foo() {
  const test = new Test();
  test.a = new Uint8Array(1_000_000_000);
  test.b = 'foo';

  return () => {
    console.log(test.b);
  };
}

const bar = foo();

queryObjects(Uint8Array); // ❌ [uint8Array]
queryObjects(Test); // ❌ [{Test}]
This is expected behavior: the returned function bar reads thtest's property, that's why its memory, along with the giant Uint8Array, is retained.
how do we fix it?
We can fix it by adding a separate reference to test.b and use that instead from the returned function.
function foo() {
  const test = new Test();
  test.a = new Uint8Array(1_000_000_000);
  test.b = 'foo';

  const { b } = test;

  return () => {
    console.log(b);
  };
}

queryObjects(Uint8Array); // ✅ empty array
queryObjects(Test); // ✅ empty array
The memory retention is easy to identify in the above example. Perhaps a more confusing example is when you have a write-only variables captured in the closure:
function fn() {
  let a;

  return () => {
    a = new Uint8Array(1_000_000_000);
  };
}
const foo = fn();

foo();
In this example, foo doesn't read variable a from its closure. It only writes to it. On top of that, there is no way for us to reach to the enclosed variable a from outside. It seems like a can be safely garbage collected. However our test with queryObjects tells us the memory allocated for a is still retained.
function fn() {
  let a;

  return () => {
    a = new Uint8Array(1_000_000_000);
  };
}
const foo = fn();

foo();
queryObjects(Uint8Array); // ❌ [uint8Array]
In theory a highly-optimized JavaScript engine could release the memory retained for a for the case as it is write-only. However it is not an easy task as it faces the halting problem. Furthermore, such a mistake can be easily prevented by a linter.
setInterval#
setInterval seems to be another usual suspect for memory leaks. Its recurring nature makes the issue even worse; memory leaks caused by it escalate very quickly.
But first, setInterval alone doesn't cause memory leaks. It doesn't prevent the callback passed to it from being garbage collected:
const myQueryObject = queryObjects; // had to call the original queryObjects from a different reference

function foo() {
  const array = new Uint8Array(1_000_000_000);

  myQueryObject(Uint8Array); // ✅ empty array
}

setInterval(foo, 1000);
In the above example, even though we invoke foo every second, array's memory gets released once foo finishes execution. No memory leaks happened.
However, nested setIntervals cause memory leaks. In the following example we can observe that queryObjects logs out an ever-growing array, which gets a new Uint8Array added every second.
const myQueryObject = queryObjects;

function foo() {
  const array = new Uint8Array(1_000);

  setInterval(() => {
    array; // referencing `array`
  }, 1000);

  myQueryObject(Uint8Array); // 🔥 ever-growing array of uint8Arrays
}
setInterval(foo, 1000);
how do we fix it?
The fix is easy though: just clear the nested setInterval via clearInterval.
const myQueryObject = queryObjects;

function foo() {
  const array = new Uint8Array(1_000);

  const intervalId = setInterval(() => {
    array; // referencing `array`
  }, 1000);

  myQueryObject(Uint8Array); // ✅ empty array
  clearInterval(intervalId);
}
setInterval(foo, 1000);
These examples are derived from A surprising JavaScript memory leak found at Meteor.
Promises#
Nolan noted in his blog post on memory leaks related to Promises, “A Promise can leak if it's never resolved or rejected, in which case any .then() callbacks attached to it will leak.” With queryObjects, we can easily verify if this is (still) true from your DevTools Console.
In the following code snippet, we create a Promise , and that never gets resolved or rejected. We then attach a callback that allocates a giant Uint8Array to its then.
const p = new Promise((resolve, reject) => {});
const giantArrayPromise = p.then(() => new Uint8Array(1_000_000_000));

queryObjects(Uint8Array); // ✅ empty array
This is expected. Since it never resolves, the callback is never called. Therefore that Uint8Array shouldn't get allocated in the first place.
Maybe Nolan was referring to something slightly different here? Let's tweak the previous example a bit:
let giantArray = new Uint8Array(1_000_000_000);

function foo() {
  const a = giantArray;
  return () => a;
}

const p = new Promise((resolve, reject) => {});
p.then(foo());

giantArray = null;

queryObjects(Uint8Array); // ❌ [uint8Array]
This time Uint8Array does leak.
The second example looks pretty similar to our first closure example. The difference here is that, instead of storing the returned function to a variable like we did in the closure example, we attach that function to a Promise's then, and that caused memory leaks.
Lastly, when I was playing around with Promise when writing this post, a surprising memory leak occurred when the resolve function of a Promise is referenced somewhere else:
let i = 0;

while (i++ < 100) {
  new Promise((resolve) => {
    document.body.addEventListener('click', resolve, { once: true });
  });
}

queryObjects(Promise); // ❌ Array(100)
The event target, which is document.body in this case, holds a reference to the resolve functions of the Promises and prevent the Promises get collected even after they were resolved. I guess this is probably because every resolve has an internal reference back to the Promise where it comes from.
We can use removeEventListener to fix it:
let i = 0;

while (i++ < 100) {
  const handler = () => resolve();

  new Promise((resolve) => {
    document.body.addEventListener('click', handler, { once: true });
    removeEventListener('click', handler);
  });
}

queryObjects(Promise); // ✅ empty array
Final thoughts#
Although queryObjects might not help much with debugging memory leaks in production, it serves as a great tool to programmatically detect memory leaks with a quick feedback loop. I found it invaluable when it comes to create a minimal reproducible examples of memory leaks and quickly validate assumptions.
By the way, Safari's DevTools Console has an API called queryHolders that lets you which exact variables are holding the reference to the leaking object. Sadly at the time of writing Chrome hasn't implemented this API yet.